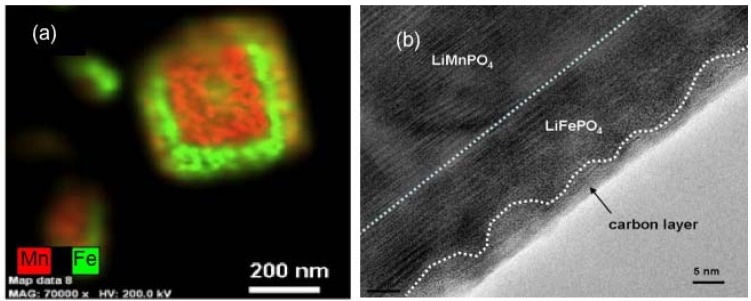
Figure 4.
(a) Energy Dispersive X-ray Detector (EDX) spectra at three spots show that both Mn and Fe in the analyzed areas with Mn peak intensity higher than Fe’s one. On average, the relative concentration Mn:Fe is 2/3:1/3. (Cu and Si are from the sample support); (b) Transmission Electron Microscope (TEM) image showing the continuous carbon coating deposited onto the LFP layer. (Reprinted with permission from [59]. Copyright 2012 Elsevier.)

