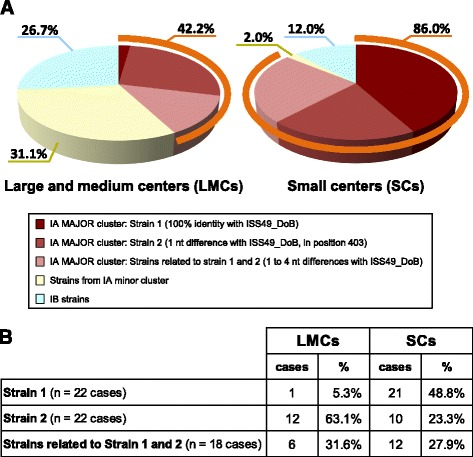
Fig. 3.

Distribution of strains according to the size of urban centers. a Distribution of the strains from the IA Major cluster, IA minor cluster and IB cluster according to the size of urban centers (see the legend of Fig. 1). The percent values are shown. b Detail of the number of cases and relative frequency of the strains from the IA Major cluster (strain 1, strain 2 and strains related to strain 1 and 2) in LMCs and SCs
