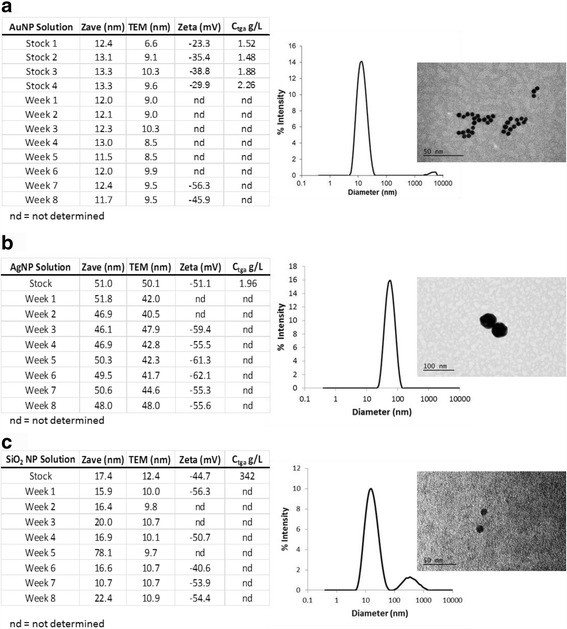
Fig. 1.

Representative DLS and TEM characterization of NP stock solutions and summary of characterization for stock and dosing solutions. Tables on the left reflect the characterization summary for each stock and dosing lot of NP solutions. Histograms and micrographs on the right show representative results from the dosing solutions. a AuNPs scale bar = 50 nm. b AgNPs scale bar = 100 nm. c SiO2 NPs scale bar = 50 nm. Note the agglomeration present in AuNPs and SiO2 NP DLS histograms as indicated by the smaller peaks at larger diameters
