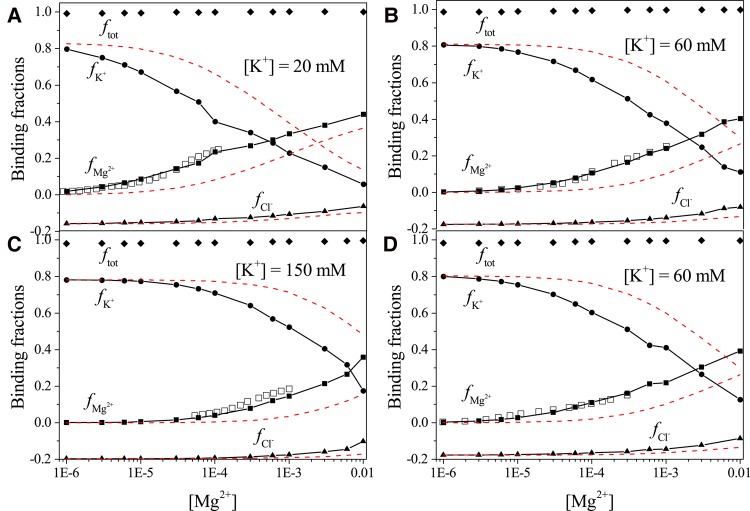
FIGURE 4.
The [Mg2+]-dependence of the ion binding fraction for each ion species: for the 58-nt fragment RNA at [K+] = 20 mM, 60 mM, and 150 mM, respectively (A–C); for the RNA–protein complex at [K+] = 60 mM (D). The temperature for all the calculations is set at 25°C. Empty squares represent the experimental data from Grilley et al. (2007) and Leipply and Draper (2011b). The red dashed lines show the ion binding fractions calculated using the NLPB model.

