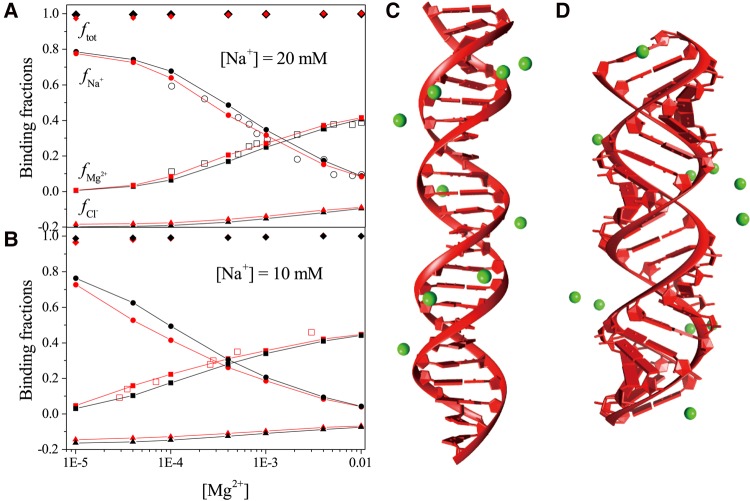
FIGURE 6.
(A,B) The [Mg2+]-dependence of the ion binding fractions for each species for 24-bp A-RNA and B-DNA at [Na+] = 20 mM (A) and 40-bp A-RNA and B-DNA at [Na+] = 10 mM (B). The black and red lines belong to B-form DNA duplex and A-form RNA duplex, respectively. The empty scatters (circles and squares) represent the experimental results of the 24-bp B-form DNA duplex from Bai et al. (2007) and the 40-bp A-form RNA duplex from Krakauer (1971). (C,D) The most possible distributions of TB ions around the 24-bp B-DNA and A-RNA structures at [Mg2+] = 1 mM and [Na+] = 20 mM.

