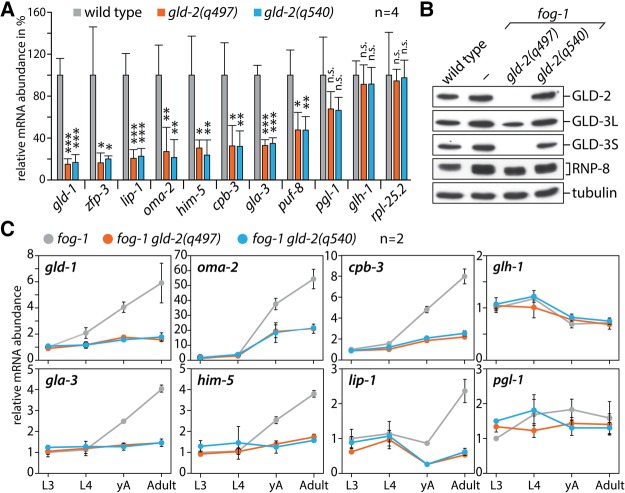
FIGURE 3.
Levels of GLD-2 target mRNAs are reduced in GLD-2(P652L)-expressing animals. (A) Abundance measurements of the indicated mRNAs via quantitative real-time PCR. Statistically significant differences are indicated and calculated via the Student's t-test. (***) P < 0.001, (**) P < 0.01, (*) P < 0.05; n.s., not significant. (B) Western blot analysis of the indicated proteins in fog-1 gld-2 double-mutant backgrounds. (C) mRNA abundance analysis during the development from L3 larvae to adults in given mutant backgrounds. L3, L3 larvae; L4, L4 larvae; earlyA, L4 + 12h; Adult, L4 + 24h.

