FIGURE 1.
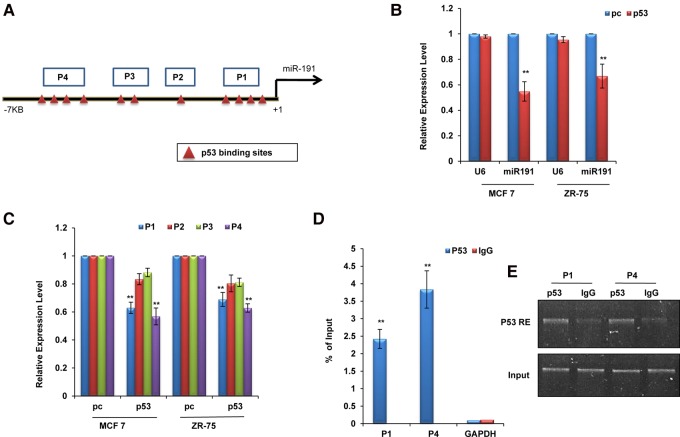
Transcriptional regulation of miR-191-5p. (A) Diagram showing putative p53 binding sites with <1% dissimilarity in the upstream region of pre-miR-191. P1–P4 refers to the four regions cloned in the pGL3 luciferase vector for studying the effect of p53 overexpression in breast cancer cells. (B) Real-time PCR data showing down-regulation of miR-191-5p levels in response to p53 overexpression as compared to the control vector (pc) in breast cancer cell lines (MCF7 and ZR-75). RNU6B (U6) has been used as a control for normalization. Graph was plotted using formula. (C) Luciferase activity of regions (P1–P4) was measured in MCF7 and ZR-75 48 h post-transfection with pc or p53. (D,E) p53 direct binding to the miR-191-5p upstream region was confirmed using ChIP analyses. qPCR (D) or semiquantitative (E) data showing enrichment of the p53 recognition elements (p53RE) in P1 and P4 regions on immunoprecipitation with p53 antibody as compared to the IgG control. The graphical data points represent mean ± SD of at least three independent experiments. (**) P < 0.01. Error bars denote ±SD.

