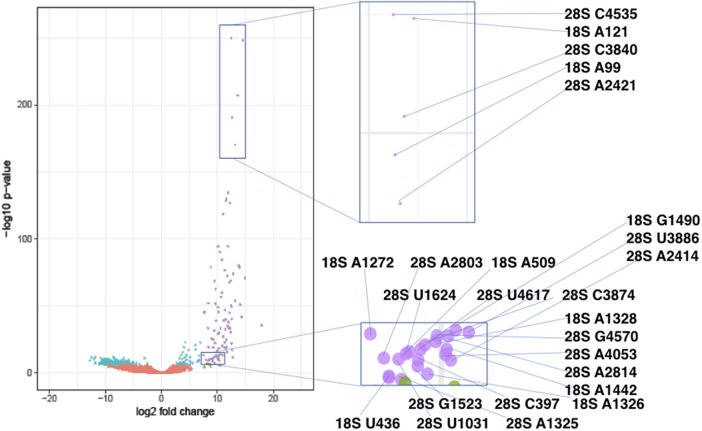
FIGURE 4.
Volcano plot of the −log10 P-value versus log2 fold change in data from human PA1 cells. Each dot represents a single base position in 18S and 28S rRNAs. Base positions were artificially filtered by P-values and log2 fold changes and color-coded. Red dots represent positions with log2 fold change ≤7 and adjusted P-value >0.0001. Teal dots represent log2 fold change ≤7 and adjusted P-value <0.0001. Green dots represent log2 fold change >7 and adjusted P-value >0.0001. Purple dots represent log2 fold change >7 and adjusted P-value <0.0001. Positions labeled with purple were determined as highest confidence sites. The zoomed-in views for two regions indicate the actual methylation sites represented by the dots. The Volcano plot was generated using the R package ggplot2 (Heng et al. 2009). RibOxi-seq was used on 7 µg samples of total RNA from PA1 cells. The NextSeq500 150 cycle Mid Output Kit was used in the 75 bp by 75 bp configuration. Across three control samples, the sequencer output was ∼14 million, ∼13 million, and ∼36 million reads for each, while oxidized samples had ∼9 million, ∼10 million, and ∼16 million reads each.

