
Fig. 4.
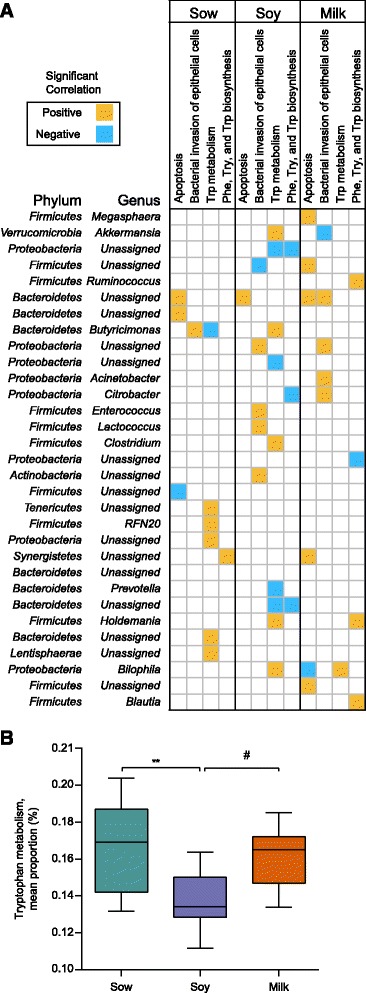
Correlation matrix of microbiota to tryptophan and cellular processes. a Significant correlations among genera and tryptophan metabolism, apoptosis, and bacterial invasion of epithelial cells are shown. The significant Spearman correlation coefficients are displayed as ellipses. Let and right directions of ellipses indicate positive and negative correlations, respectively. b The bar graph shows the prediction analyses of tryptophan metabolism. (**p < 0.05 for milk diet in comparison to sow-fed, # p < 0.05 for milk diet in comparison to soy diet)