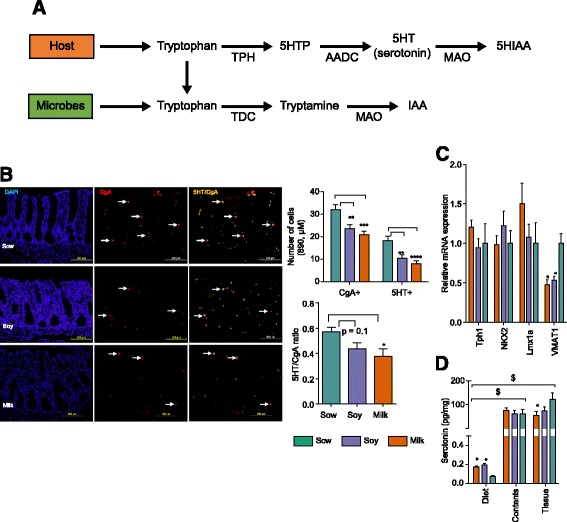
Fig. 5.

Formula diets alter the serotonin level in porcine neonates fed with soy or milk formula relative to sow diet. a Cartoon displays the tryptophan metabolism to serotonin and bacterial tryptamine and the enzymes involved in the pathway (b) The digital images show the immunostaining of EC cells in distal colon sections with 5-HT (green), CgA (red) and 5-HT/CgA (yellow). The bar graph displays the decrease in a number of EC cells in soy- and milk-fed groups relative to the sow-fed group. (c) Relative EC cell gene expression in distal colon tissue. (d) Serotonin level in diets (n = 3–4/diet group), distal colon tissue (normalized with tissue weight), distal colon contents of soy and milk groups in comparison to the sow-fed (n = 12/group). Data were analyzed by two-way ANOVA followed by post hoc test (Tukey’s). (*p < 0.05, **p < 0.01, ***p < 0.001, ****p < 0.0001 for formula diet in comparison to sow-fed, $ p < 0.005 comparison of serotonin levels in diets versus contents or tissue independent of treatment group). EC = Enterochormaffin cells, CgA = Chromogranin A
