
Fig. 8.
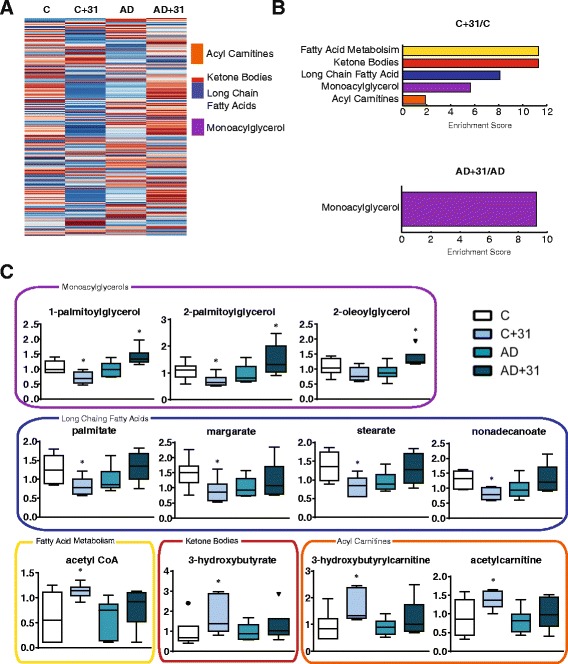
Metabolic analysis of the cortex in CAD-31-treated mice. a Heat map of average levels of lipids from the cortex, grouped by class. General trends showed that CAD-31 had a consistent effect on lipid levels. b Metabolite enrichment scores were generated, and metabolite groups significantly changed were determined. c Individual significantly changed metabolites from the enriched pathways are plotted. The control (C), CAD-31-treated control (C + 31), Alzheimer’s mice (AD), and AD mice treated with CAD-31 (AD + 31) metabolite levels are color-coordinated to the enrichment graph. The control compared with the CAD-31-treated control and the AD vs CAD-31-treated AD mice demonstrated general trends in lipid metabolism. One-way analysis of variance and Tukey’s post hoc test were used to determine statistical significance. * p < 0.05. n = 6 per group. CoA Coenzyme A