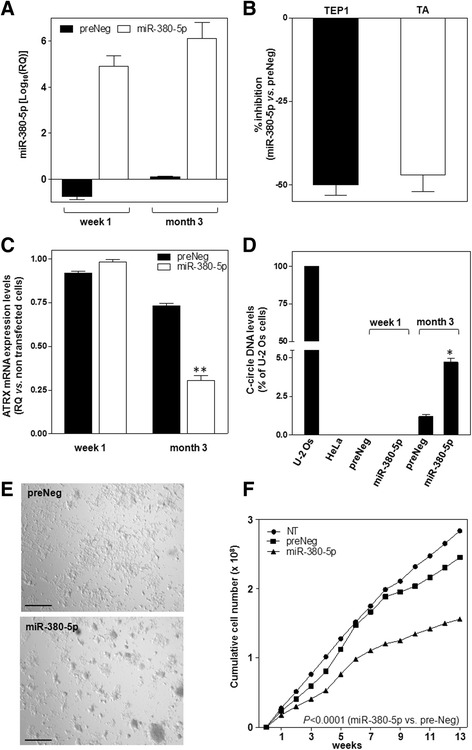
Fig. 5.

miR-380-5p mixes up the phenotype of DMPM cells. a Assessment of miR-380-5p expression levels upon weakly transfection of STO cells with preNeg or miR-380-5p precursor (Log10(RQ) with respect to NT cells; mean values ± s.d.). b Quantification of TEP1 mRNA levels and of TA in miR-380-5p expressing cells at month 3. Data have been reported as percentage inhibition (mean values ± s.d.) in miR-380-5p- vs. preNeg-transfected cells. c Assessment of ATRX expression levels (RQ in preNeg- and miR-380-5p-transfected vs. NT cells; mean values ± s.d.); **P < 0.01 for miR-380-5p vs. preNeg. d Quantification of C-circle DNA levels in preNeg- and miR-380-5p-transfected cells at the indicated time points (percentage of c-circle DNA levels in each sample with respect to U-2 Os cells; mean values ± s.d.); HeLa: negative control; *P < 0.05 for miR-380-5p vs. preNeg at month 3. e Representative photomicrographs showing the morphology of preNeg- and miR-380-5p-transfected STO cells. Original magnification: ×4; Scale bar: 100 μm. f Growth curves of NT, preNeg- and miR-380-5p-transfected STO cells. Data have been reported as cumulative number of growing cells over a 3-month period. The level of statistical significance for the comparison between preNeg and miR-380-5p groups has been assessed by two-way ANOVA
