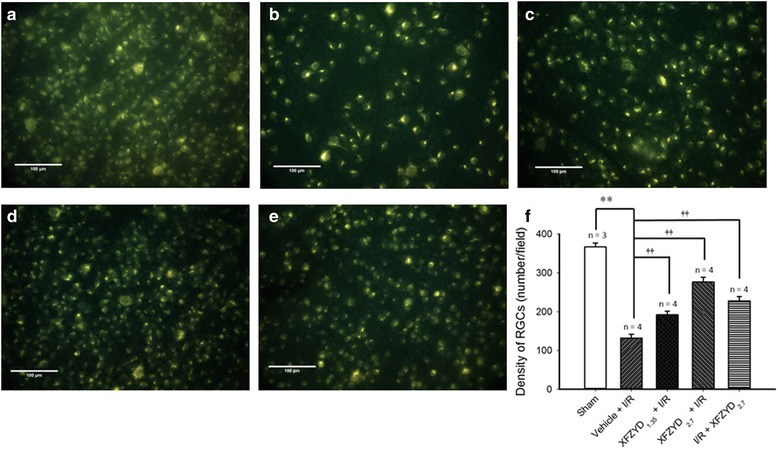
Fig. 2.

Retrograde staining with fluorogold. The micrographs revealed the density of retinal ganglion cells (RGCs) after the sham process (a, Sham), ischemia plus reperfusion (I/R) with preadministered vehicle (b, Vehicle + I/R), preadministered XFZYD at 1.35 g/kg/day (c, XFZYD1.35 + I/R), preadministered XFZYD at 2.7 g/kg/day (d, XFZYD2.7 + I/R), or postadministered XFZYD at 2.7 g/kg/day (e, I/R + XFZYD2.7). Quantitative analysis of the density of RGCs is shown (f). The mean values ± SD (n = 3 ~ 4) was shown for each bar. ** represents a significant difference (p < 0.01; Sham vs. Vehicle + I/R); †† represents a significant difference (p < 0.01; Vehicle + I/R vs. XFZYD1.35 + I/R, XFZYD2.7 + I/R or I/R + XFZYD2.7). XFZYD, Xue-Fu-Zhu-Yu decoction. Scale bars = 100 μm
