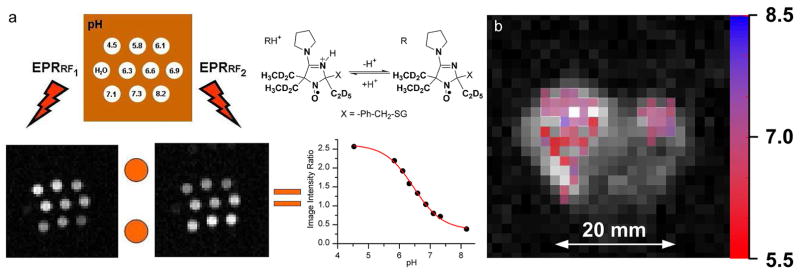
Figure 10.
(a) Illustration of the variable radio frequency (VRF) OMRI approach for the case of pH-mapping. Two OMRI images of the phantom were acquired during EPR irradiation (8.4 s) at two preselected EPR frequencies, rf1 = 559.3 MHz and rf2 = 562.1 MHz, which correspond to EPR resonances of RH+ and R forms of the deuterated NR5 probe. pH values of 1 mM solutions of NR5 are indicated on the phantom picture. The calibration curve was calculated as pH dependence of the ratio of signal amplitudes, I(rf1)/I(rf2). (b) pHe mapping of living mouse by OMRI. pH map (in color) was superimposed with low-field MRI (gray scale) showing the transverse view of the mouse. The pH probe was injected into the number 4 mammary gland containing tumor (left) and in the number 9 normal mammary gland (right) before OMRI/MRI acquisitions. The pH map was calculated from two OMRI images, acquired during EPR irradiation at two EPR frequencies, rf1 and rf2. Total acquisition, 24.8 s. From ref 8 with permission from John Wiley & Sons, Ltd. Copyright 2012 John Wiley & Sons, Ltd.

