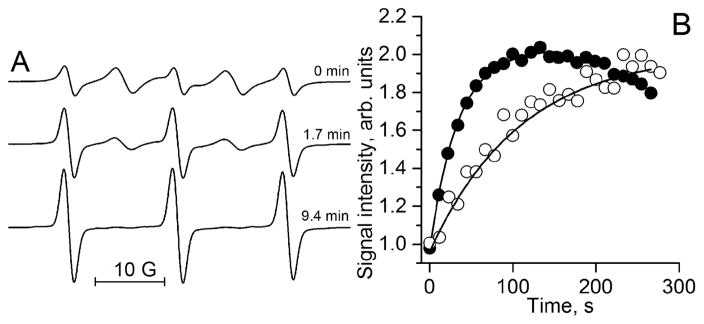
Figure 3.
(A) X-band EPR spectra of 100 μM R2S-SR2 measured at various time points after incubation with 2.5 mM GSH in 0.1 M Na-phosphate buffer, pH 7.2, and 1 mM DTPA at 34 °C. The kinetics analysis provides the observed rate constant value of the reaction between GSH and R2S-SR2, kobs(pH 7.2, 34 °C) = 2.8 ± 0.2 M−1 s−1. (B) Kinetics of the monoradical spectral peak intensity change measured in mammary tumor (●) and normal mammary gland (○) using L-band EPR. The solid lines are the fits of the initial part of the kinetics by the monoexponent supposing kobs (pH 7.2, 34 °C) = 2.8 M−1 s−1 and yielding [GSH] = 10.7 mM and 3.3 mM for the tumor and normal mammary gland, correspondingly. Reproduced from ref 8 with permission of John Wiley & Sons, Inc. Copyright 2012 John Wiley & Sons, Inc.

