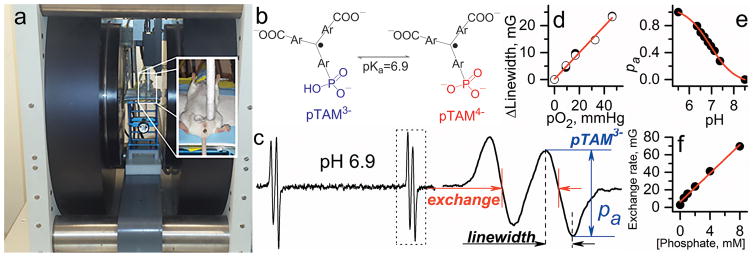
Figure 5.
Multifunctional assessment of chemical microenvironment using pTAM HOPE probe. (a) Setup for in vivo L-band EPR measurements of the tissue microenvironment parameters in living mice. Photograph shows the anesthetized mouse between the magnets of the EPR spectrometer with the inset on the right showing placement and positioning of the loop resonator on top of the measured tissue. (b) The scheme of pH-dependent equilibrium between two ionization states of the probe. (c) L-band EPR spectrum of pTAM. (d) The EPR line width of the pTAM is a pO2 marker (accuracy, ≈ 1 mmHg; pO2 range, 1–100 mmHg). (e) The fraction of protonated pTAM is a pH marker in the range from 6 to 8.0 (accuracy, ±0.05). (f) Dependence of proton exchange rate (expressed in mG) of the pTAM with inorganic phosphate on Pi concentration extracted by spectra simulation (accuracy, ±0.1 mM; range, 0.1–20 mM).28,29 Note interstitial extracellular localization of the pTAM probe: it does not penetrate into the cells due to bulky charged structures and the pTAM signal from the blood is not detected by EPR due to signal broadening by pTAM complexation with plasma albumin.70 Reproduced from ref 71 with permission of Nature Publishing Group. Copyright 2017 Nature Publishing Group

