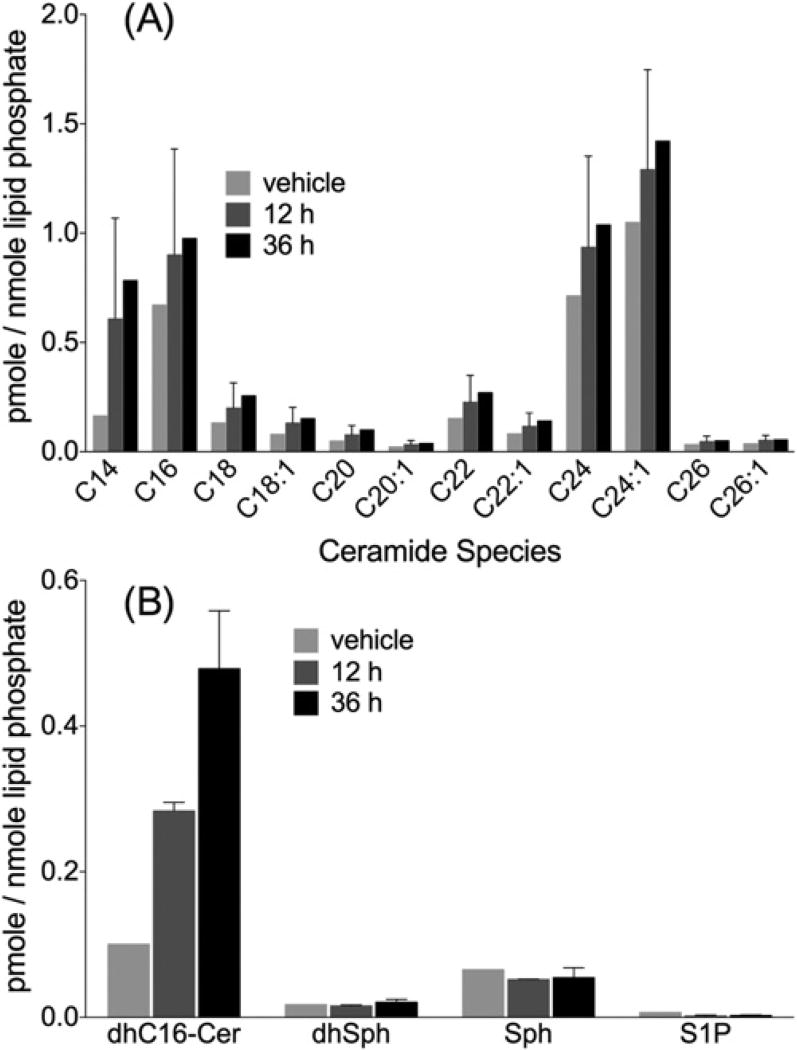
Figure 4. 2DG/AA treatment increases ceramides but not Sph or S1P in nCDase−/− MEFs.
nCDase−/− MEFs were treated with vehicle or 2DG (20 mM) and AA (7.5 µm) for different times (0–36 h). Cells were harvested, lipids extracted and subjected to HPLC–MS/MS analysis for quantification of (A) the levels individual ceramide species (C14–C24) and (B) C16-dhCer, dhSph, Sph and S1P. Results were normalized to total lipid phosphate and are the means ± S.D., n = 3.

