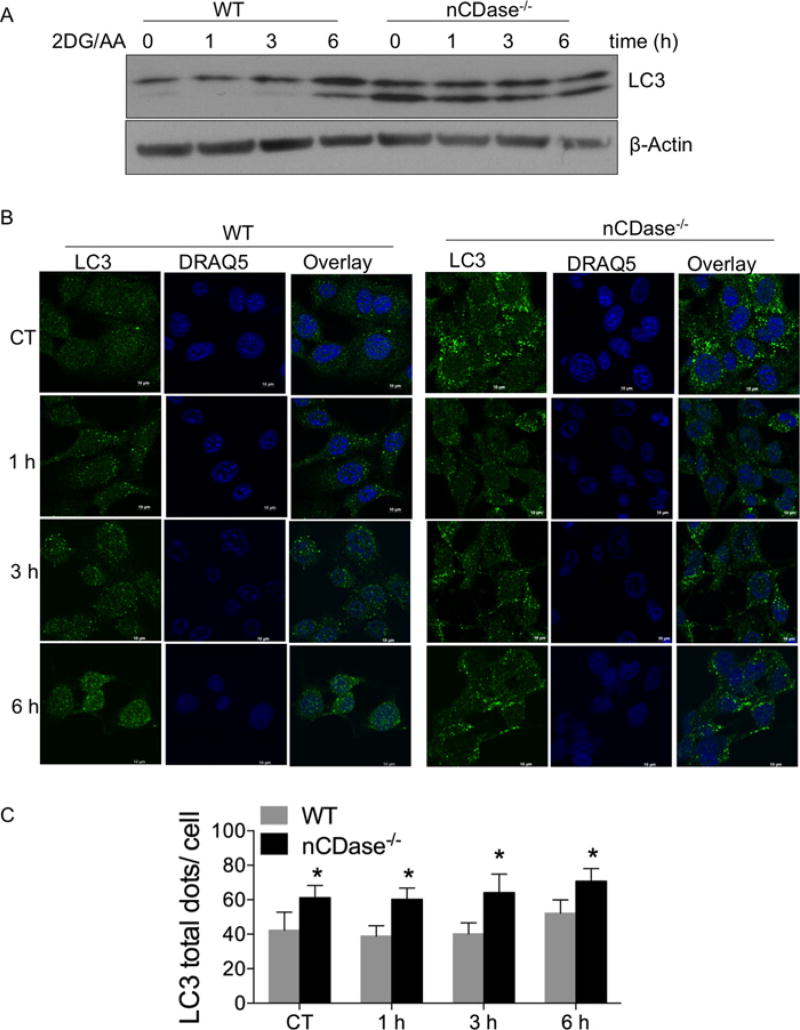
Figure 5. nCDase−/− cells have higher levels of autophagy following treatment with 2DG/AA.
WT and nCDase−/− MEFs were treated with vehicle (CT, control) or 2DG (20 mM) and AA (7.5 µM) for different times. (A) Total cell lysates were subjected to Western blot analysis for LC3. β-Actin expression served as a loading control. (B) Cells were fixed and permeabilized. Cells were incubated with primary antibody directed against LC3 and appropriate fluorescently conjugated secondary antibody. DRAQ5 was utilized for nuclear staining. Cells were imaged via confocal microscopy. (C) Quantification of the total number of LC3 dots per cell is expressed as means ± S.D. for two independent experiments each with technical triplicates (*P < 0.05).

