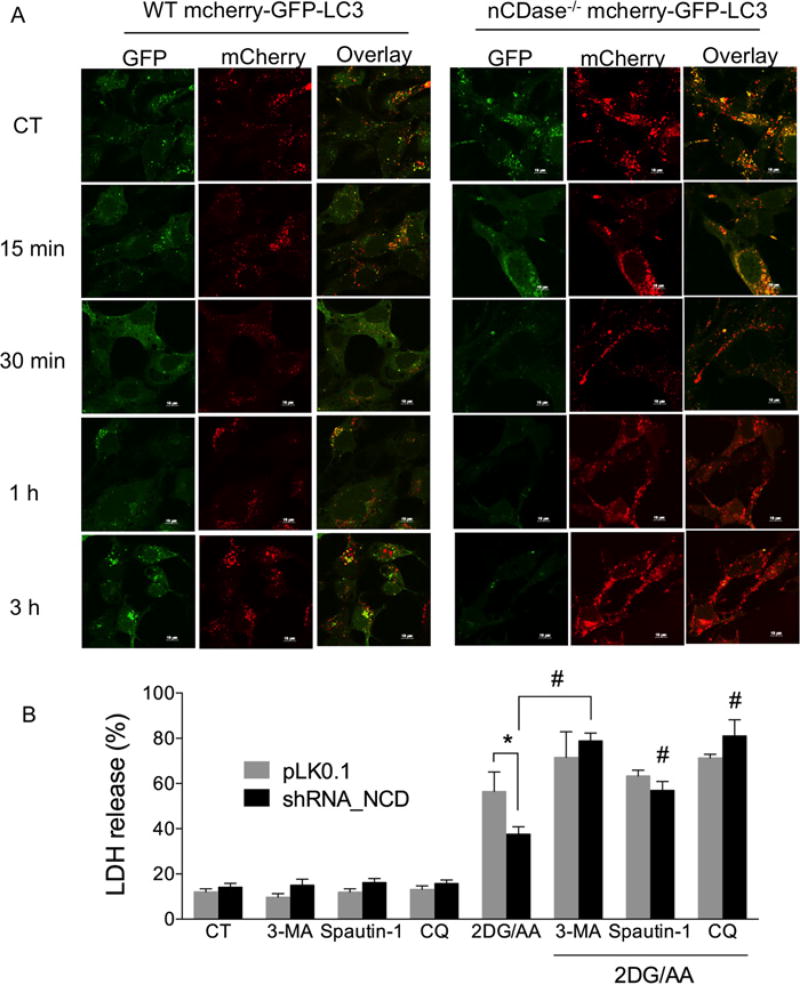
Figure 6. Autophagic flux is higher in nCDase−/− than in WT MEFs and inhibiting autophagy sensitizes cells to 2DG/AA-induced cell death.
(A) WT and nCDase−/− cells were transduced with mCherry–GFP–LC3 plasmid and cells were treated with vehicle (CT, control) or 2DG (20 mM) and AA (7.5 µM) for the indicated times (0–3 h). Cells were fixed, permeabilized and imaged by confocal microscopy. Shown are example images taken from a minimum of ten fields of view per treatment and three independent experiments. (B) WT cells stably expressing non-targeting control shRNA (pLKO.1) or nCDase-specific shRNA (shRNA_NCD) were pre-treated where indicated with vehicle control or the indicated autophagy inhibitor such as 3-MA (2 mM), Spautin-1 (1 µM) or CQ (25 µM) for 3 h followed by treatment with vehicle or 2DG/AA (20 mM and 7.5 µM respectively) for 24 h. The percentage of LDH release was then determined. Results are the means ± S.D. for three independent experiments. * and # indicate P < 0.05 as determined by one-way ANOVA. For (B), * indicates a comparison between WT pLKO.1 and WT nCDase_shRNA values, whereas # denotes statistical significance between WT nCDase_shRNA cells treated with 2DG/AA with and without a given inhibitor of autophagy.

