Fig. 2.

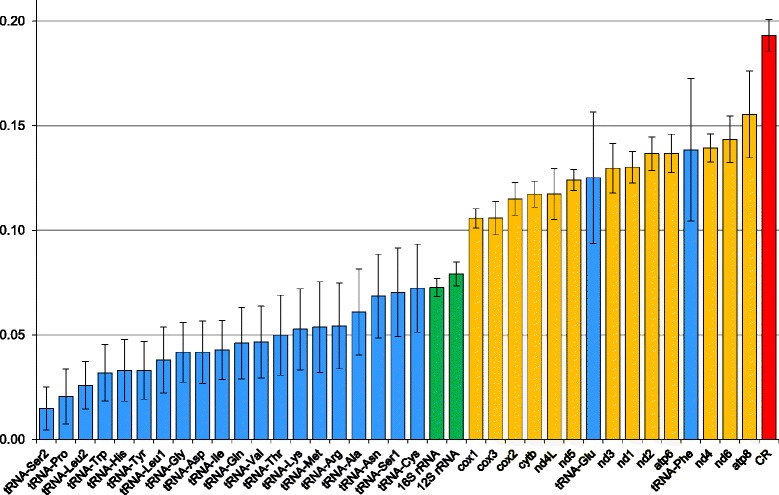
The average evolutionary divergence, i.e. the mean number of nucleotide substitutions per site, for individual sets of Arini markers. The whiskers indicate standard error calculated using the bootstrap approach

The average evolutionary divergence, i.e. the mean number of nucleotide substitutions per site, for individual sets of Arini markers. The whiskers indicate standard error calculated using the bootstrap approach