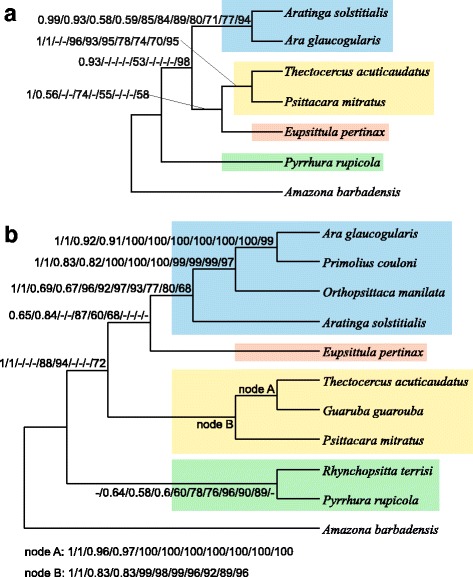
Fig. 9.

Tree topologies obtained for the ALL data set subjected to RY-coding for 7- (a) and 11-taxa set (b). Numbers at nodes correspond to support values calculated using the following methods: MrBayes under partitioned and not-partitioned model, PhyloBayes assuming CAT and Poisson model, TreeFinder under partitioned and not-partitioned model, maximum likelihood, weighted least squares, minimum evolution, neighbour joining and maximum parsimony in PAUP. The posterior probabilities ≤0.5 and bootstrap percentages ≤50 were indicated by a dash “-”
