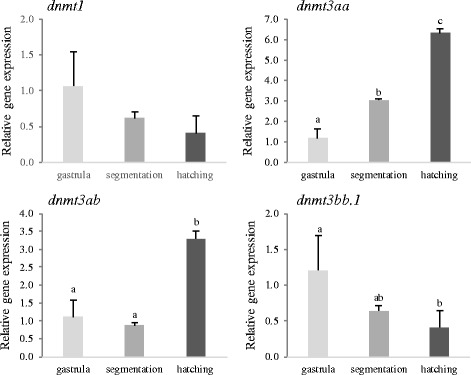
Fig. 2.

Expression levels of the dnmt1, dnm3aa, dnmt3ab and dnmt3bb.1 at gastrula, segmentation and hatching in embryos incubated at 16 °C and 20 °C. Data are expressed as the mean fold change (mean + SD, n = 3) from the calibrator group (gastrula). Different letters denote statistically significant differences among developmental stages for each gene (P < 0.05)
