
Fig. 4.
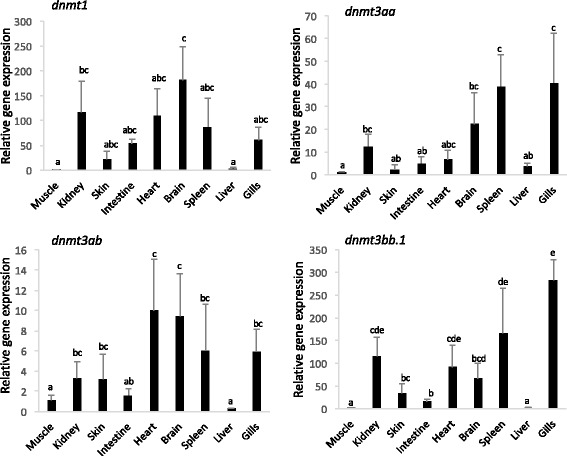
Relative expression levels of the four dnmts in sole juvenile tissues: muscle, kidney, skin, intestine, heart, brain, spleen, liver and gills. Data were expressed as the mean fold change (mean + SD, n = 4) from the calibrator group (muscle). Different letters denote statistically significant differences among tissues for each gene (P < 0.05)