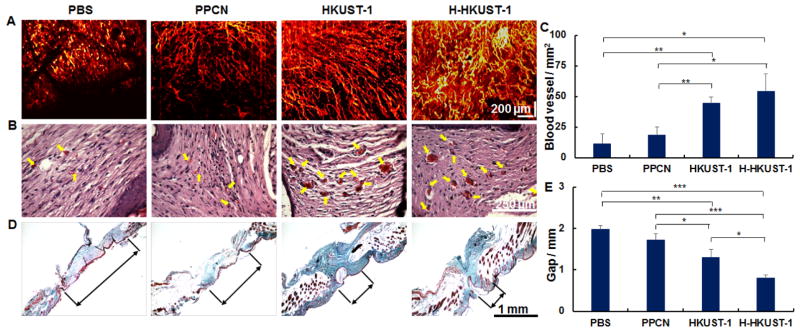
Figure 5.
Analysis of healed wounds. A) Blood vessels observed by OCTA on day 32. B) Blood vessels (arrows) observed after H&E staining. C) Quantification of blood vessel density in H&E-stained tissue sections. D) Collagen distribution (light green) in healed skin as per Masson’s trichrome stained tissue sections. E) Quantification of granulation tissue gap measured in Masson’s trichrome stained tissue sections. (n=6, *p < 0.05, **P < 0.01, ***P < 0.001).

