Figure 6.

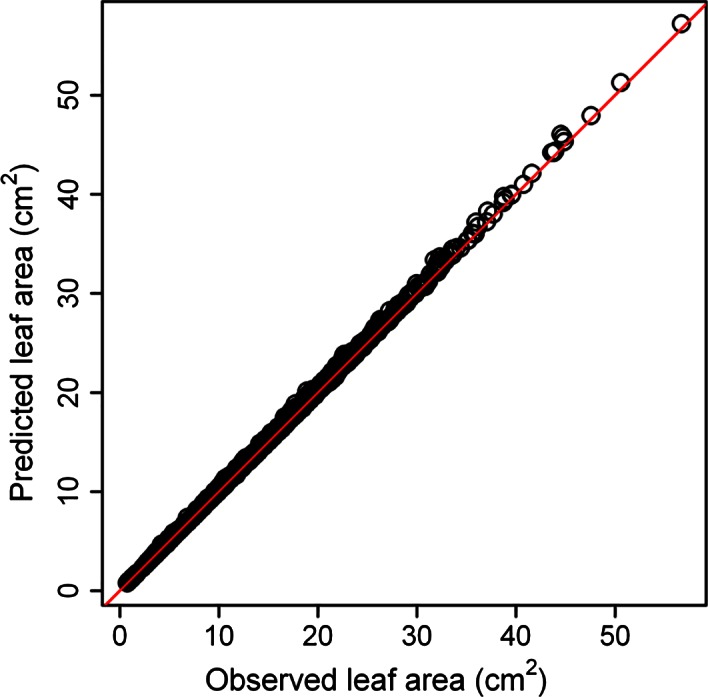
Comparison between the real and predicted leaf areas estimated from the simplified Gielis equation. The red straight line represents y = x, the small open circles are made up of the actual leaf areas and the predicted leaf areas

Comparison between the real and predicted leaf areas estimated from the simplified Gielis equation. The red straight line represents y = x, the small open circles are made up of the actual leaf areas and the predicted leaf areas