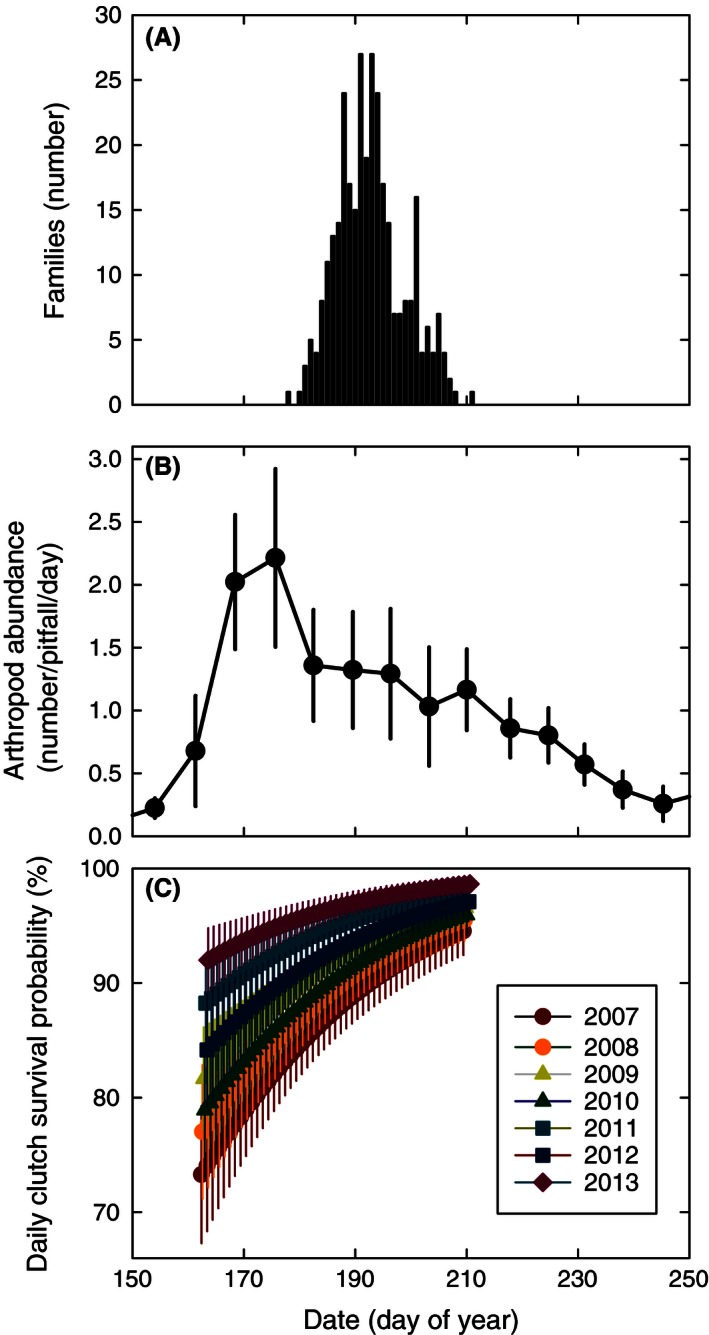
Figure 3.

The frequency distribution of Sanderling (estimated and actual) hatch dates per day of year (A), seasonal changes in arthropod abundance (B), and the average seasonal increase in Sanderling clutch survival (C) in Zackenberg in 2007–2013. The average hatching date is 12 July (day of year = 193). The distribution in (A) includes failed clutches, whose hatch date was predicted based on egg flotation. Arthropod abundance (B) is expressed in number of individuals per pitfall trap corrected for the number of sampling days. The line shows the average ±SE across years. Samples on different dates were lumped within week. Seasonal patterns in daily clutch survival (C) of Sanderlings in Zackenberg in the years 2007–2013 based on the most parsimonious model in which year and date additively explain the variation in clutch survival.
