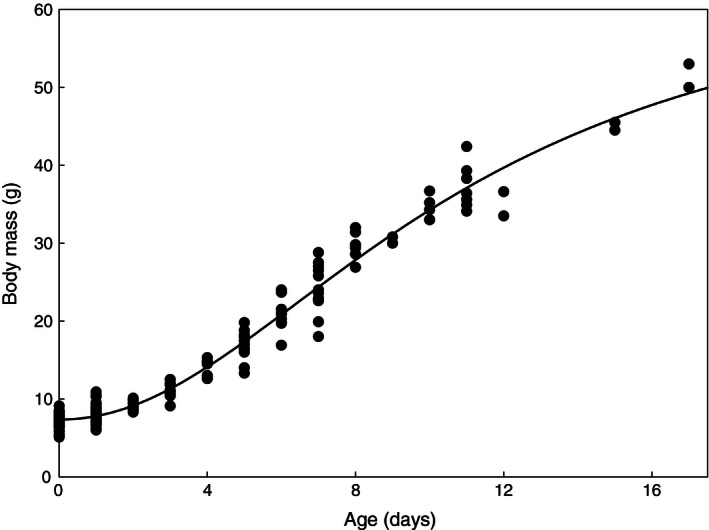
Figure 5.

Growth of body mass of Sanderling chicks. Each dot represents the body mass of individual chicks at a given age (in days). Some dots overlap and some individuals were repeatedly measured. We accounted for pseudo‐replication in fitting the depicted curve, using a nonlinear mixed model with individual as a random factor (see Materials and Methods).
