
Figure 1.
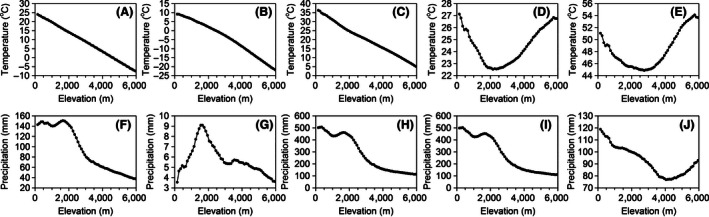
Temperature seasonality‐elevation (A), min temperature of the coldest month‐elevation (B), max temperature of the warmest month‐elevation (C), annual temperature range‐elevation (D), annual mean temperature‐elevation (E), precipitation seasonality‐elevation (F), precipitation of the driest month‐elevation (G), precipitation of the wettest month‐elevation (H), annual precipitation range‐elevation (I), and mean monthly precipitation‐elevation (J). All of the data were downloaded from the Worldclim (http://www.worldclim.org/) (Hijmans, Cameron, Parra, Jones, & Jarvis, 2005)