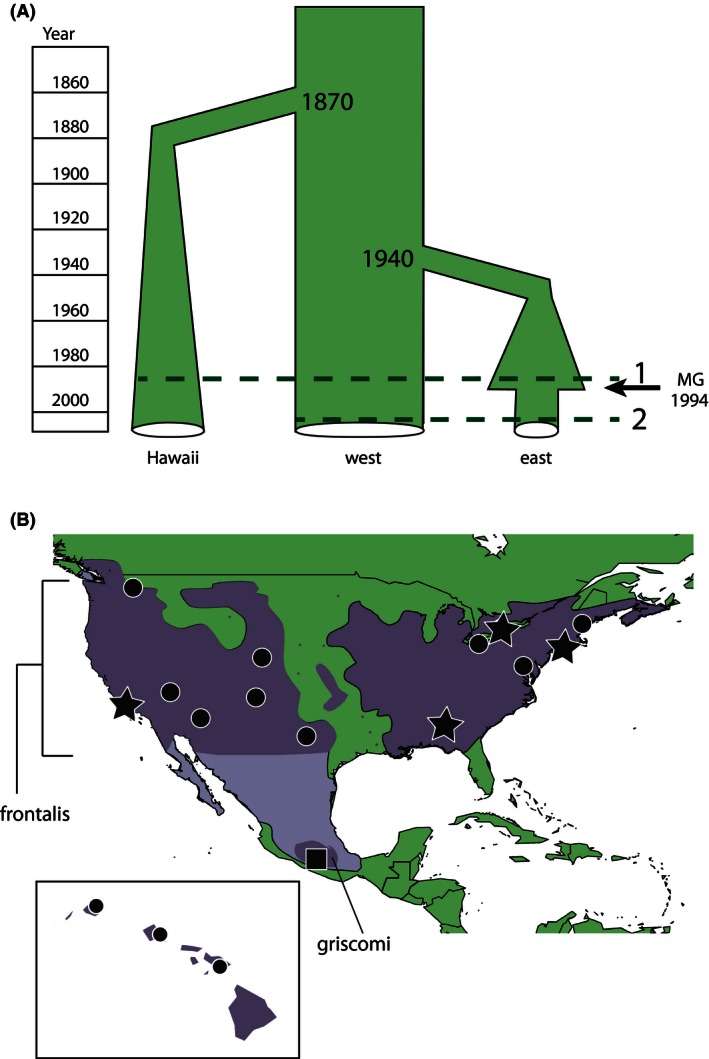
Figure 1.

Approximate demographic history associated with population introductions in Hawaii and the eastern United States, and the MG epizootic event in the eastern United States. Line 1 on the figure indicates the approximate sampling time for the pre‐epizootic samples, and line 2 indicates the approximate sampling time for the post‐epizootic samples. (B) Map of the House Finch sampling localities, including Hawaii, and the range circa 1990 (NatureServe 2011; Ridgely et al. and Birdlife International 2011). All frontalis subpopulations (circles and stars) were sampled before the MG epizootic (line 1 on panel A), and the subpopulations indicated by a star were sampled again in 2001 or 2003, approximately eight generations after the MG epizootic (line 2 on panel A). The griscomi subspecies was also sampled (square). The ranges of the frontalis and griscomi subspecies are highlighted.
