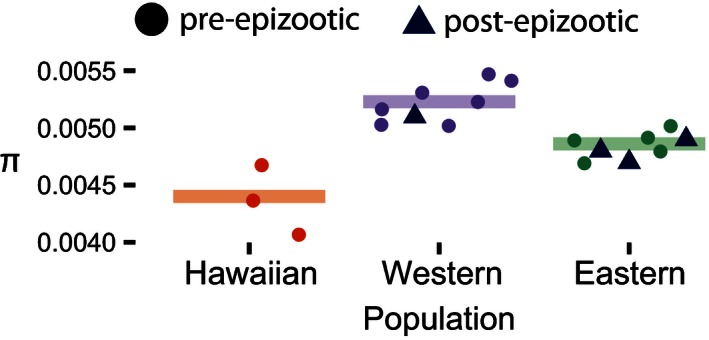
Figure 3.

Estimates of diversity (π) for all subpopulations from dataset 1. The bars indicate the mean pre‐epizootic π value. Reductions in nucleotide diversity (π) are more severe in the Hawaiian population than the eastern population, with 15.8% and 7.0% reductions in the estimated mean subpopulation π, respectively. Pre‐epizootic estimates are circles, and post‐epizootic estimates are triangles
