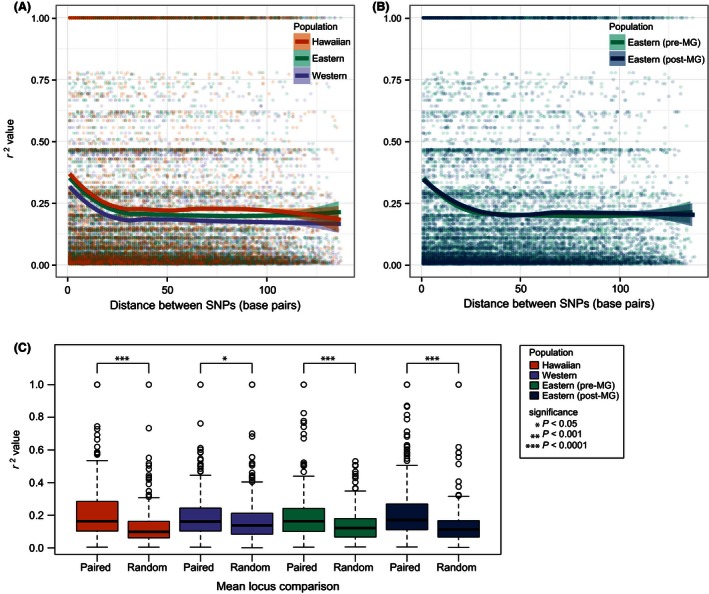
Figure 4.

(A) Pre‐epizootic population linkage disequilibrium (r 2) calculations between the pairs of SNPs located on the same RAD locus. From eight randomly chosen individuals with less than 50% missing data, the LOESS smoothed r 2 values (solid lines) and 95% SE confidence intervals (shaded areas) are shown for each SNP distance. (B) LD (r 2) calculations between pairs of SNPs located on the same RAD locus. For eight Pre‐E and Post‐E individuals, the LOESS smoothed r 2 values (solid lines) and 95% SE confidence intervals (shaded areas) are shown for each SNP distance. (C) Mean LD (r 2) between SNPs on read 1 and read 2 of the same DNA fragment (paired; 375 pairs of loci) compared to two randomly chosen loci (random; 375 random pairs)
