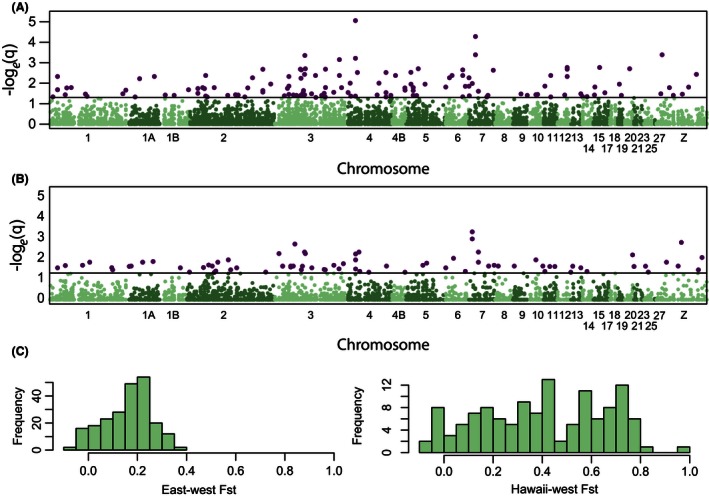
Figure 5.

False discovery rate‐corrected q‐value from Fisher's exact test for different allele frequencies between (A) Pre‐E and Pre‐W populations and (B) Hawaiian and Pre‐W populations plotted according to position on the Zebra Finch genome. A horizontal black line indicates the 5% significance threshold, and the SNPs with q‐values that fall below this threshold used in downstream analyses are colored purple. (C) Distribution of F ST values observed in outlier loci identified in (A) and (B) for Pre‐E and Pre‐W and Hawaiian and Pre‐W comparisons
