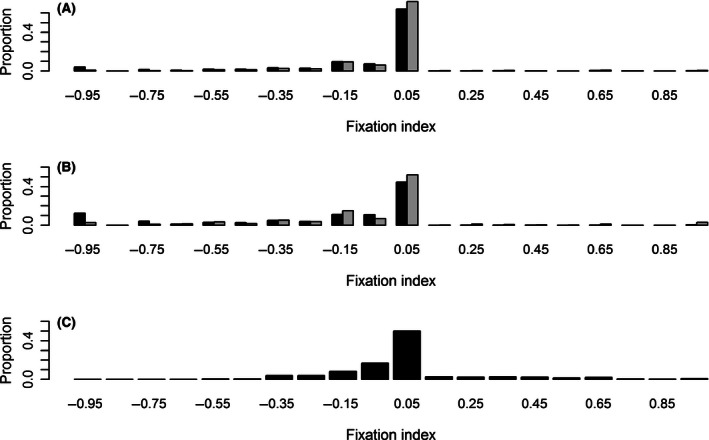
Figure 5.

Distribution of inbreeding coefficients (FIS) for RAD loci detected in silico at 4× (A) and 18× coverage (B), as well as for the 330 SNP loci validated by individual genotyping (C). For (A) and (B), the results obtained using all RAD loci are shown in black and those obtained after the removal of paralogous RAD loci are shown in gray
