
Figure 5.
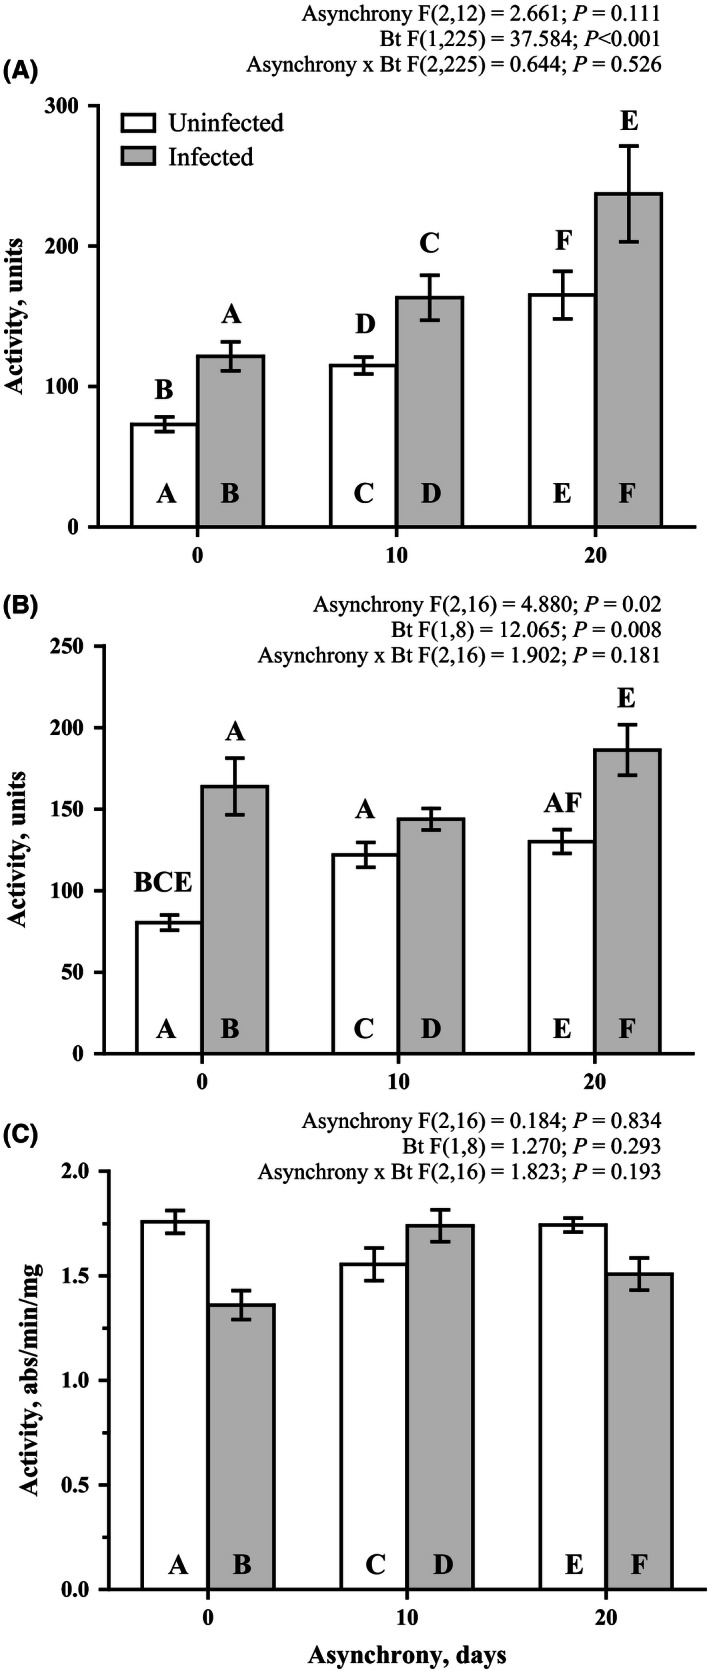
Effects of asynchrony and Bacillus thuringiensis infection on the lytic activity in hemolymph plasma (A), lytic activity in the midgut tissue (B), and nonspecific esterase activity in the midgut tissue (C) of Lymantria dispar fourth‐instar larvae on the first day after infection. The results of a mixed model analysis are provided above the figure. The results of pairwise comparisons (Fisher LSD tests) are indicated by letters. The letters above the bar indicate significant differences (at p < .05) compared with the bars identified by the same letters within the bar