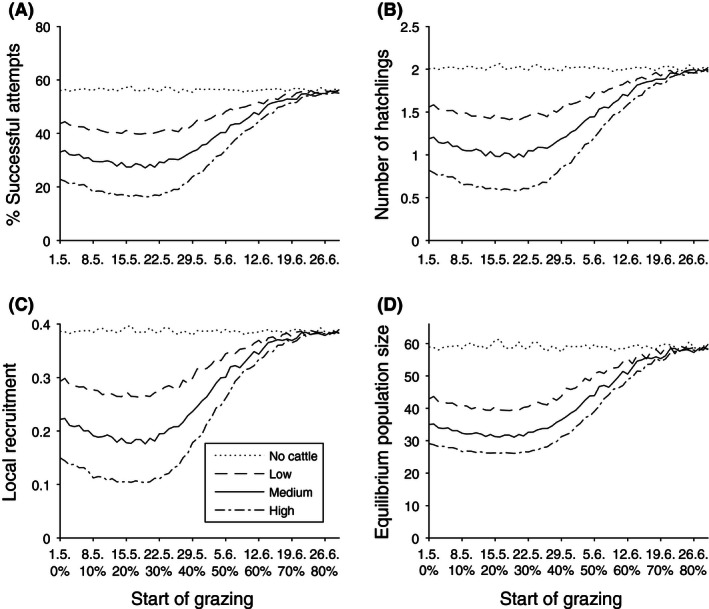
Figure 3.

(A) The percentage of failed nesting attempts, (B) number of hatchlings, (C) local recruitment per female, and (D) predicted equilibrium population sizes (females) under different intensities and starting dates of grazing. Start of grazing (x‐axis) is represented by date (May 1st = 1) and the percentual advancement of the breeding season.
