
Figure 4.
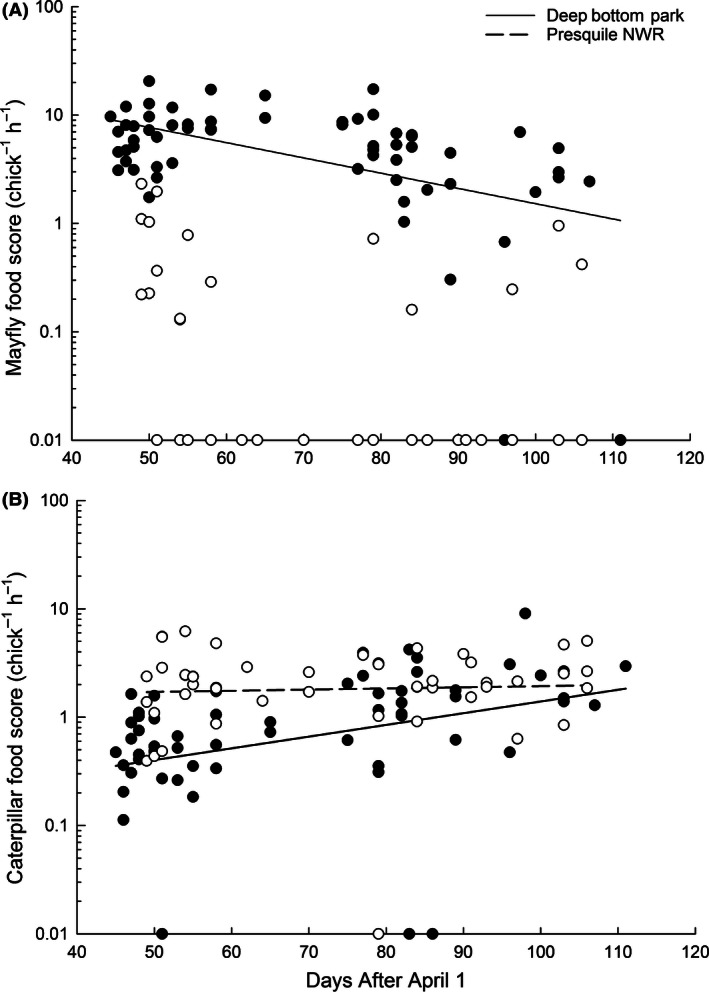
Total mayfly (A) and total caterpillar (B) food score brought to nestling prothonotary warblers by date at the two study sites; Deep Bottom (closed circle, solid line) and Presquile (open circle, dotted line). The Presquile mayfly line was not plotted because it did not meet the assumptions of normality due to the high number of zero values (see text). Nests that were fed no mayflies or caterpillars were given values of 0.01 because zero values do not appear on a log scale.