
Figure 5.
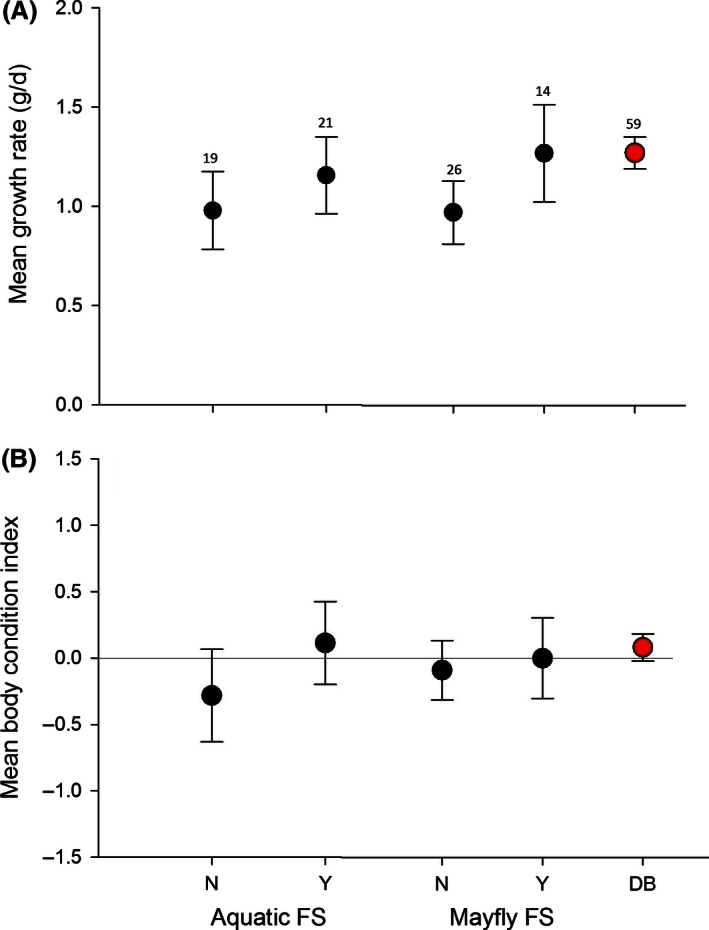
Mean growth rate (A) and body condition (B) for Deep Bottom (red) and Presquile (black). Presquile nest boxes were divided into categories representing whether or not they were fed mayfly prey or any aquatic prey. The figure represents means and 95% confidence intervals.