
Figure 1.
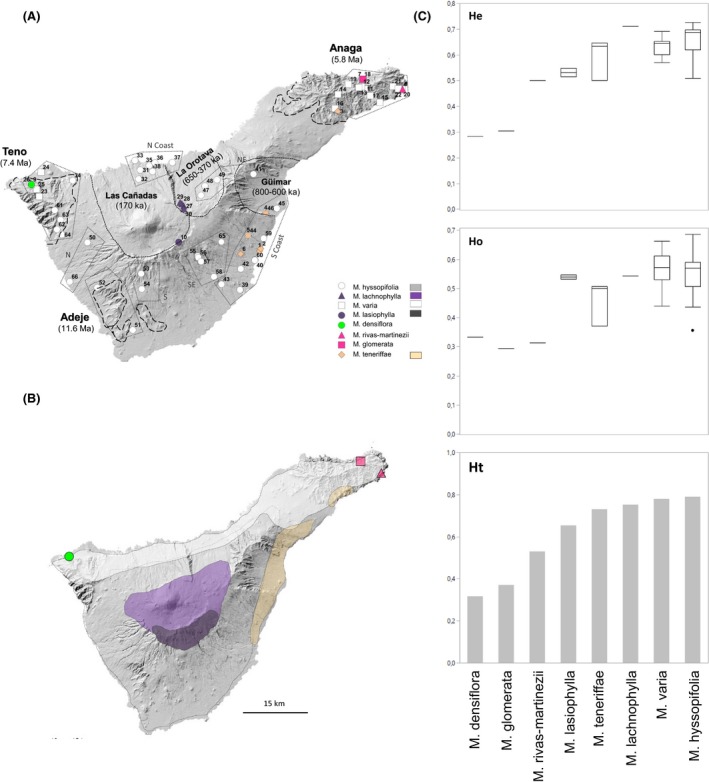
Maps of Tenerife showing: (A) Micromeria sampling localities; long‐dashed lines indicate remnants of paleo‐islands; short‐dashed lines indicate major valleys; dotted polygons indicate regions formed by geographically close populations (see Table 1); symbol shapes and colors correspond to different species of Micromeria; numbers on symbols indicate collection localities (see Table 1); (B) distribution of Micromeria species. Species distributions were obtained by converting a point per quadrant dataset from Pérez de Paz (1978) into continuous ranges. Individuals of M. varia on the central north coast had been assigned to M. hyssopifolia in the meanwhile (Puppo et al. 2014); (C) genetic diversity for each species calculated as H E (upper right), H O (middle right), and H T (bottom right). The boxplots showing H E and H O were made from single values estimated per population.