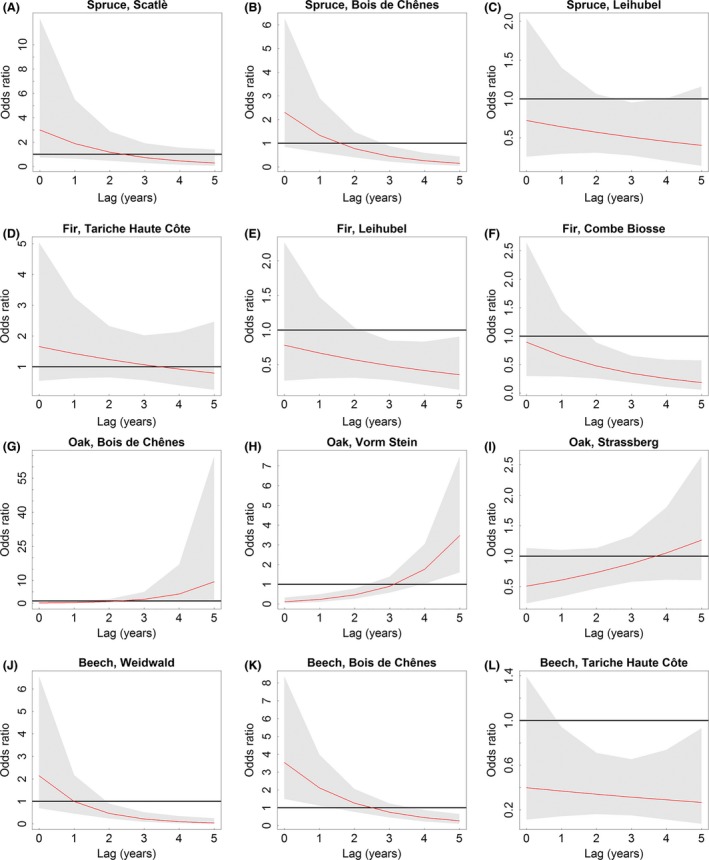
Figure 5.

Predicted odds ratios (red curve) including 95% confidence intervals (gray) for site‐specific minimum Standardized Precipitation Evapotranspiration Index values (i.e., most severe droughts) from lag 0 (year of drought event) to lag 5 (5 years after drought event). Panels within species are listed in ascending order of forest reserve codes (cf. Table 1).
