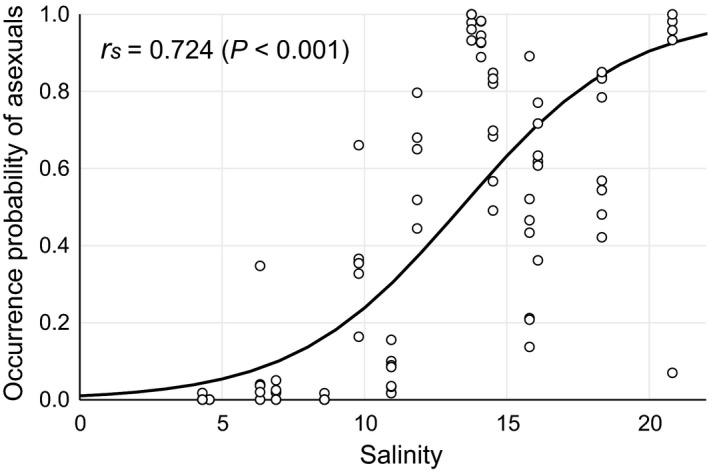
Figure 9.

A relationship between monthly asexual rate and average salinity in every growth season at S1‐5. Regression line represents occurrence probability of asexual variant projected by the maximum estimation method. r s denotes Spearman's correlation coefficient.
