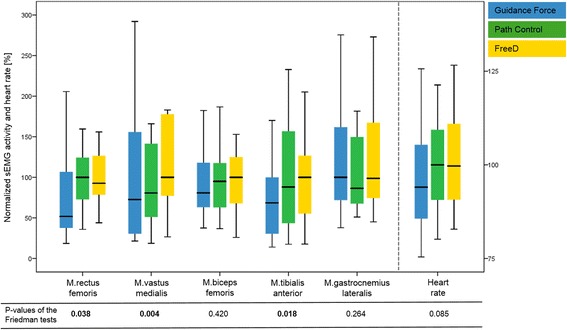
Fig. 5.

sEMG amplitudes and heart rate during walking under the three different control modes. To facilitate a comparison, the conditions were normalized by setting the highest median sEMG activity value of the three walking conditions for each muscle to 100% (and the same for heart rate). To improve visualization, outliers are not shown in the figure. However, they are included in the statistical analyses. P-values of the Friedman tests for each muscle and for heart rate are shown below the graph. Statistically significant data are indicated in bold
