
Fig. 2.
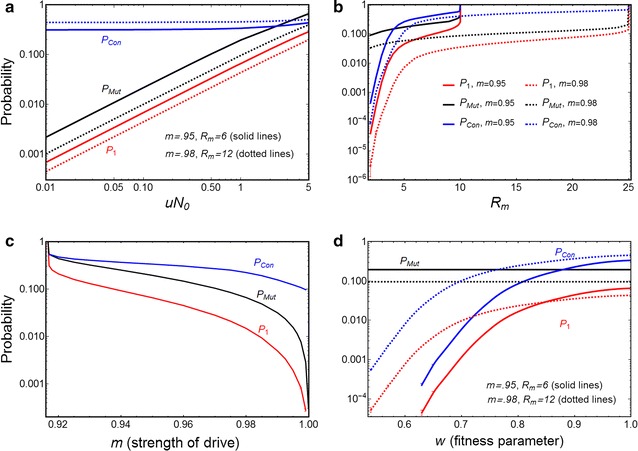
(black lines), P 1 (red lines), and P con (blue lines) for resistant cost-free mutations. a Probabilities and P Mut increase with increasing uN 0, for R m = 6 and m = 0.95 (solid lines) or R m = 12 and m = 0.98 (dotted lines). b All probabilities increase with increasing R m, for m = 0.95 (solid lines) and (dotted lines), with uN 0 = 1. Curves only extend as far as R m = 1/[2(1 − m)(1 − u)] (see Additional file 1: end of Section A1.1b) above which the strength of Y drive m < m crit and population elimination does not occur. c Probabilities decrease with increasing (strength of Y drive), for R m = 6, uN 0 = 1. d Probabilities increase with increasing mutant fitness parameter w, for (solid lines) and (dotted lines), and . The deterministic model shows that the population will be eliminated for w ≤ 0.563 for m = 0.95, and for for m = 0.98. For all plots, h 0 = 0.05. Error bars at low and high m show the standard error for simulations (averaged over runs, N 0 = 106), when the branching process model does not apply; if not shown, error is within thickness of plot line