
Fig. 4.
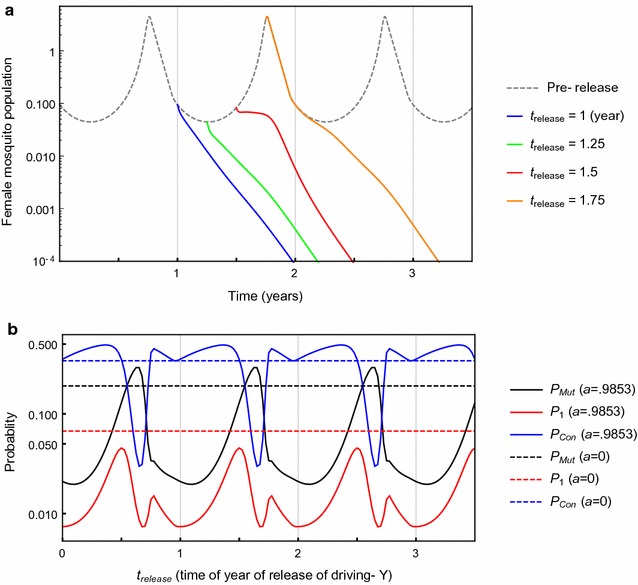
a Time evolution of wild-type female mosquito population F(t) before driving Y release (dotted line), and for introduction of the driving Y at time T (blue line), 1.25T (green line), 1.5T (red line), and 1.75T (orange line). For R m = 6, m = 0.95, T = 18.25, h 0 = 0.05, w = 1, a = 0.9825 (amplitude selected for peak to trough ratio of 100:1). Note h 0 is the proportion of the time-averaged pre-release population size , so the absolute numbers released at different time points are assumed to be the same. b , P 1, and as a function of the time when the driving Y is released during the period T of the seasonally-varying wild-type population, for a = 0.9825 (solid lines) and a = 0 (dotted lines; no seasonality). For parameters R m = 6, m = 0.95, h 0 = 0.05, uN 0 = 1, w = 1, T = 18.25, and with adjusted as described as above, such that average wild-type populations over a period