
Fig. 1.
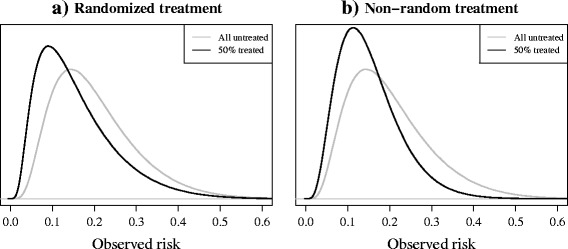
a-b: Risk distributions in two simulated validation sets. 50% of individuals received an effective treatment (relative odds reduction on treatment: 0.5), (see Table 2 scenarios 2 and 1, respectively, for details). a the model was validated on the combined treatment and control group of a randomised trial. b the model was validated using data from a non-randomised setting where the probability of receiving treatment depended on an individual’s (untreated) outcome risk. Black lines represent the observed risks in the validation set, after treatment. Grey lines represent the risks of the same individuals had they (hypothetically) remained untreated