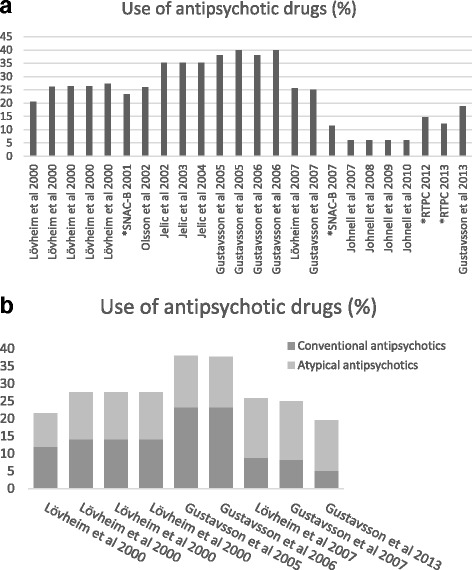
Fig. 2.

a. Included studies in the review. The histogram demonstrates the trend of use of antipsychotic drugs in Sweden from year 2000 to 2014. On the x-axel the authors and the data collection year is described. * represents unpublished data from the two studies SNAC-B and RTPC. b. In some of the studies included in the review the share of conventional and atypical antipsychotics was mentioned. The histogram demonstrates the trend of use of antipsychotic drugs in Sweden from year 2000 to 2014. On the x-axel the authors and the data collection year is described
