
Fig. 2.
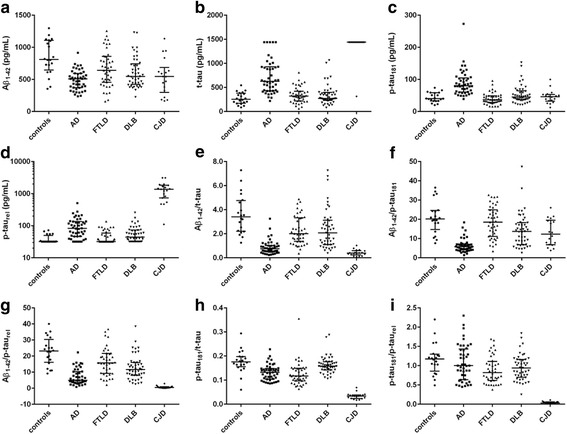
Dot plots of individual markers and ratios. Dot plots showing individual biomarker levels in each subgroup. a amyloid-beta of 42 amino acids (Aβ 1–42); b total tau protein (t-tau); c tau protein phosphorylated at threonine 181(p-tau 181); d non-phosphorylated tau fraction (p-tau rel); e Aβ1–42/t-tau; f Aβ1–42/p-tau181; g Aβ1–42/p-taurel; h p-tau181/t-tau; i p-tau181/p-taurel. Lines indicate median with interquartile range. AD Alzheimer’s disease, CJD Creutzfeldt-Jakob disease, DLB dementia with Lewy bodies, FTLD frontotemporal lobar degeneration