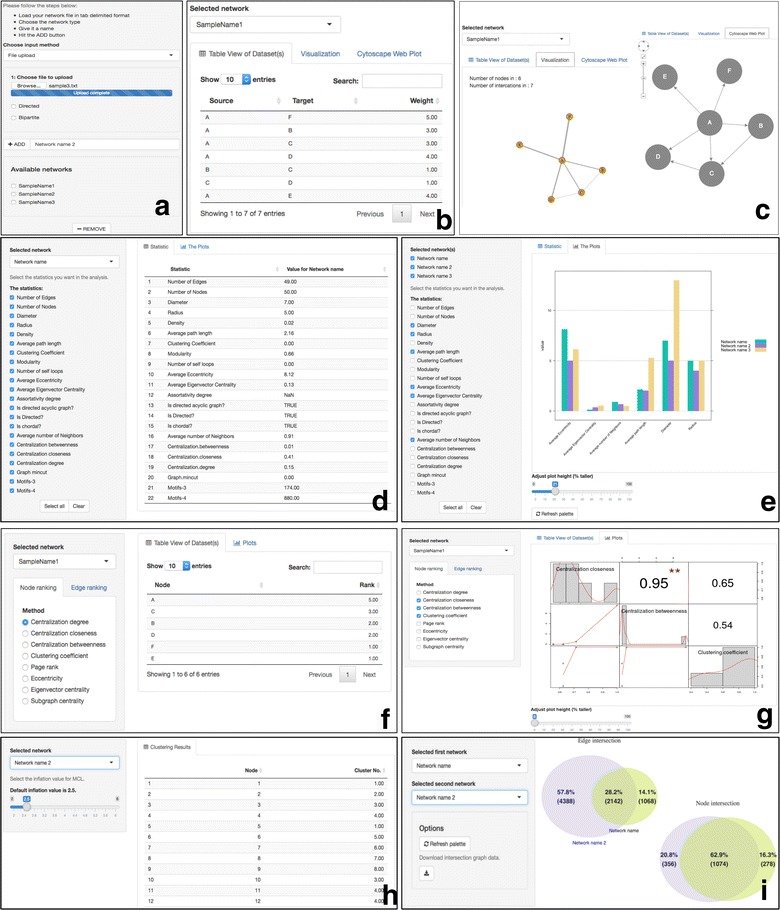
Fig. 1.

NAP’s web interface. a Users can upload several networks in the form of a list (pairwise connections) and subsequently name them. Users can also generate graphs of various sizes (50, 100, 1000, 10,000) based on the Barabási–Albert, Erdos–Renyi or Watts–Strogatz small-world model. Additionally, users can generate bipartite graphs of various sizes. b Network contents in the form of searchable and sortable tables. c-left Static network visualization. c-right Interactive Cytoscape.js network visualization. d Selection of topological features and their values. e Inter-network comparisons of topological features. f Node/edge ranking in the view of searchable tables. g Intra-network topological feature comparison in the form of a matrix. h Implementation of MCL clustering algorithm. i Intersection of any two chosen networks
