Fig. 3.

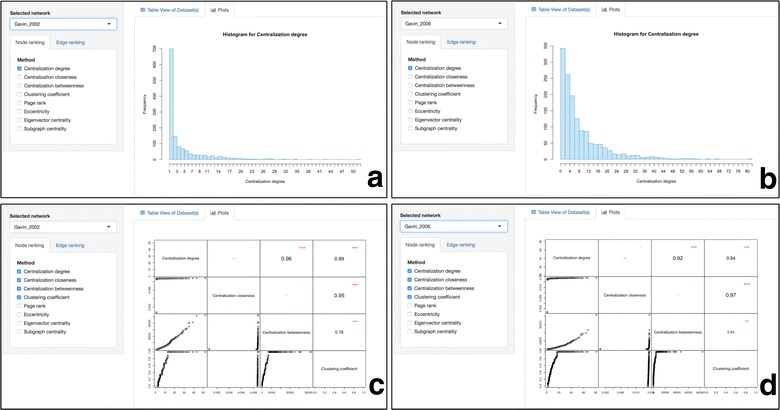
Intra-network comparison of selected topological features within the Gavin 2002 yeast PPI dataset [16]. a The degree distribution for Gavin 2002 dataset. b The degree distribution for Gavin 2006 dataset. c An all-against-all distribution matrix comparing the degree, the closeness, the betweenness and the clustering coefficient for Gavin 2002 PPI network. d An all-against-all distribution matrix comparing the degree, the closeness, the betweenness and the clustering coefficient for Gavin 2006 PPI network
