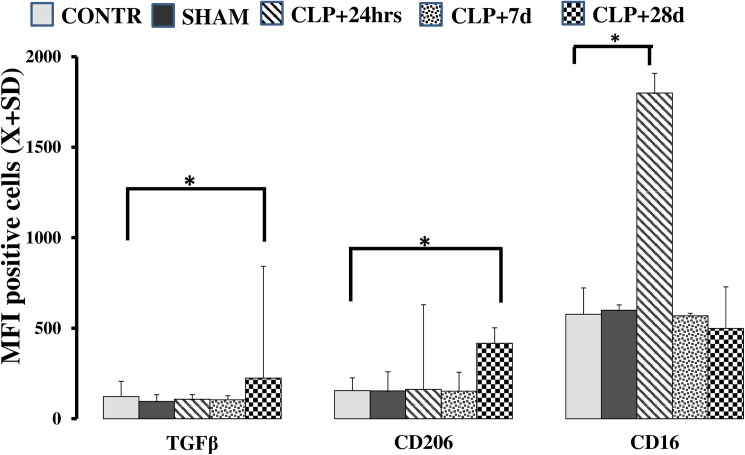
Fig 3. Flow cytometry in MO after CLP suggests an M1-to-M2 shift.
Post-CLP, a late increase in expression of TGFβ/LAP (Mean Fluorescence Intensity (MFI); p = 0.047) and CD206 (p = 0.049) was seen. In contrast, expression of CD16 was increased only shortly after CLP MFI (p = 0.022) compared to pre-CLP expression levels.

