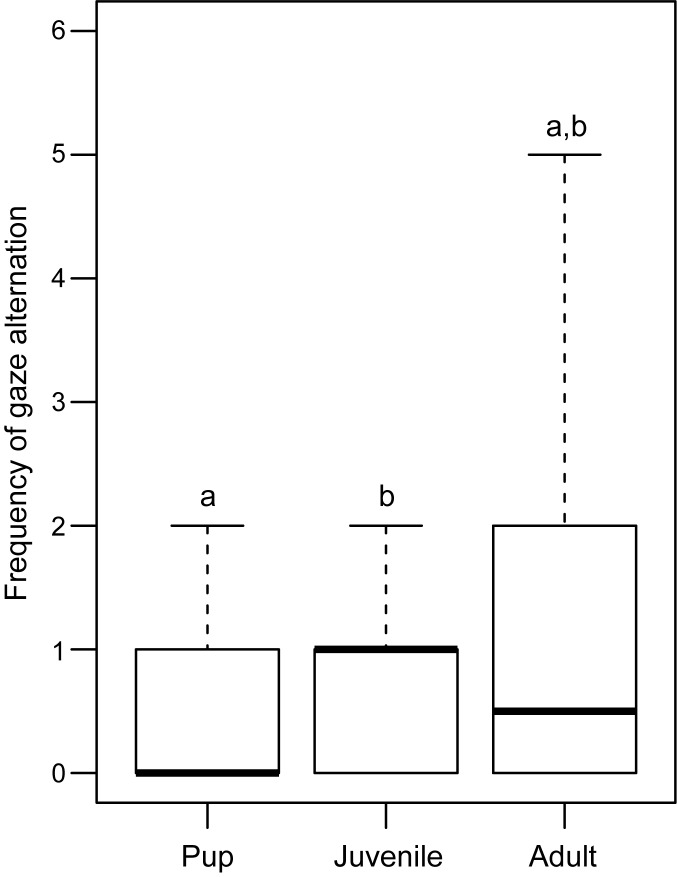
Fig 4. Box and whiskers plot showing the frequency of gaze alternation shown by pups, juveniles and adults.
Frequency of gaze alternation was significantly higher in juveniles than pups (Mann Whitney U test, p = 0.029). Boxes represent interquartile range, horizontal bars within boxes indicate median values, and whiskers represent the upper range of the data. “a” and “b” indicate significant differences among the categories.

